
Before investing heavily in marketing and user acquisition, it is vital to know if your product is good enough and can keep the users. Otherwise you will just be pouring more water into a leaky bucket. Unfortunately, it is not always straightforward to spot this, and your typical key metrics can be deceiving. If you have a leak, you need to know where it is and how to fix it.
Many of us know that counting total users is a vanity metric. It’s more useful to count active users. Total users will keep growing and the metric won’t tell when things start to decline. Therefore, measuring active users is more meaningful. However, even the active users count doesn’t reveal all underlying problems. Let’s explore this further.
Take a look at the diagram below (figure 1):
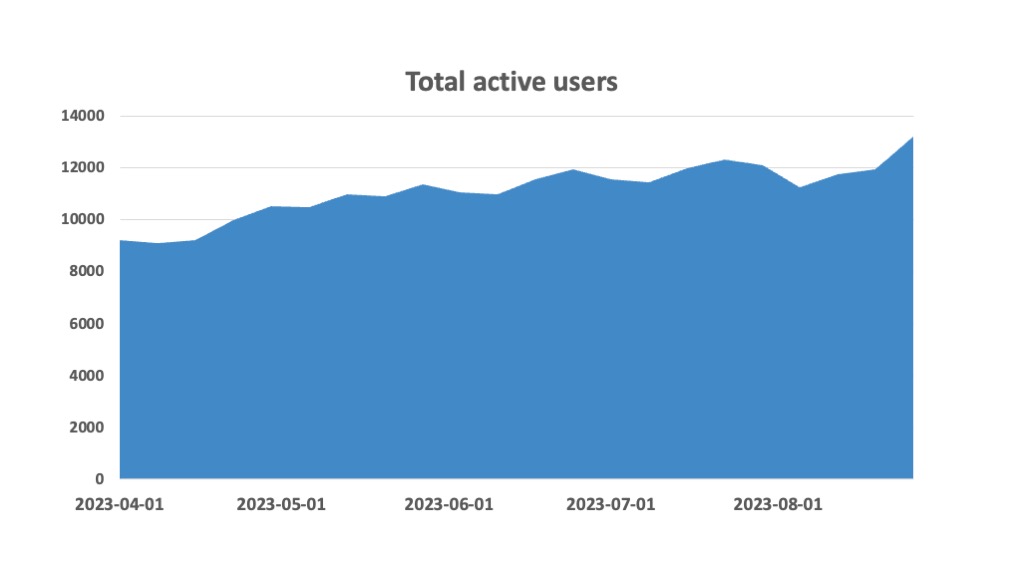
This looks somewhat ok. Apart from slow growth, no major problems are apparent yet. You might have heard complaints about high marketing spend without results or that new users are being acquired at the same rate as before, but growth has suddenly stalled. From this graph it does not appear like users would be churning (leaving). What’s happening?
Analyzing user growth and retention through total active users over time can be deceiving. It’s hard to tell if growth is due to acquiring new users faster than old ones are leaving. This scenario is like filling a leaky bucket – unsustainable in the long run. Without the right granularity in the data, it’s like trying to understand a book by only looking at the cover.
Enter Cohort Analysis:
By splitting users into cohorts (groups) based on the month they signed up we can better reveal what is happening beneeth the surface. Take a look at the table 1.
Table 1: Each row represents a cohort (group) of users who signed up during the corresponding month. The columns labeled 0-6 show the number of users still active (i.e., not churned) after the given number of months. For example, the 0 column indicates how many users initially signed up.
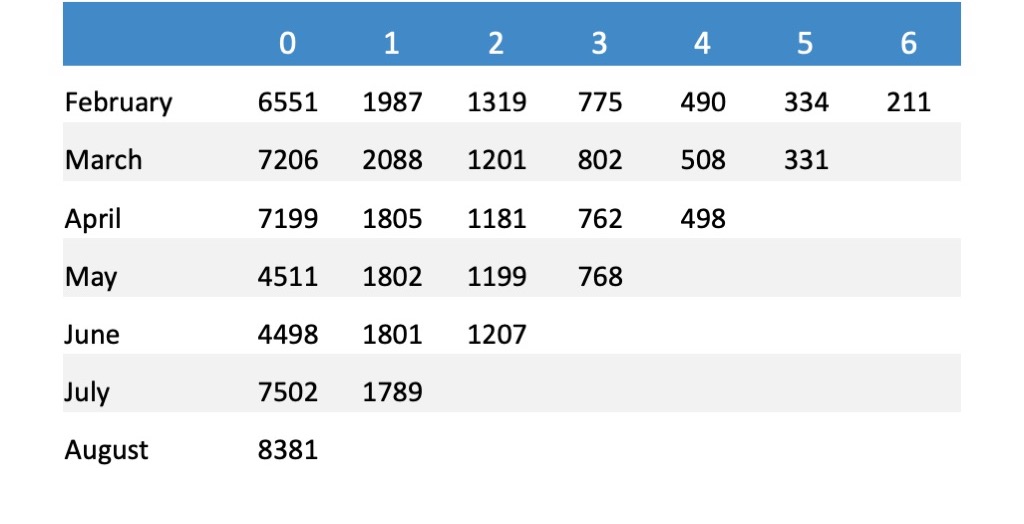
Here, each cohort of users who signed up during a specific month is shown in its own row. For each cohort, the table displays the number of active users remaining after 0-6 months. For example, the first row represents the February cohort, i.e., users who signed up any time during February. This cohort started with 6,551 users, listed under column 0. After 1 month, only 1,987 of these users remained active; after 2 months, 1,319 remained. Finally, after 6 months, only 211 users were still active.
You might wonder why only the February cohort has measurements up to month 6, while the August cohort only has data for month 0. The reason is that this example dataset only contains data up until the end of August, so each cohort only has data from its start until the end of August. Therefore, earlier cohorts have been measured longer than newer ones.
It’s often convenient to display these numbers as percentages of the users still active from the original cohort, instead of absolute numbers. See Table 2 for this representation. This representation allows easier comparison between cohorts.
Table 2: Percentage of users still active in the cohort after 0-6 months.
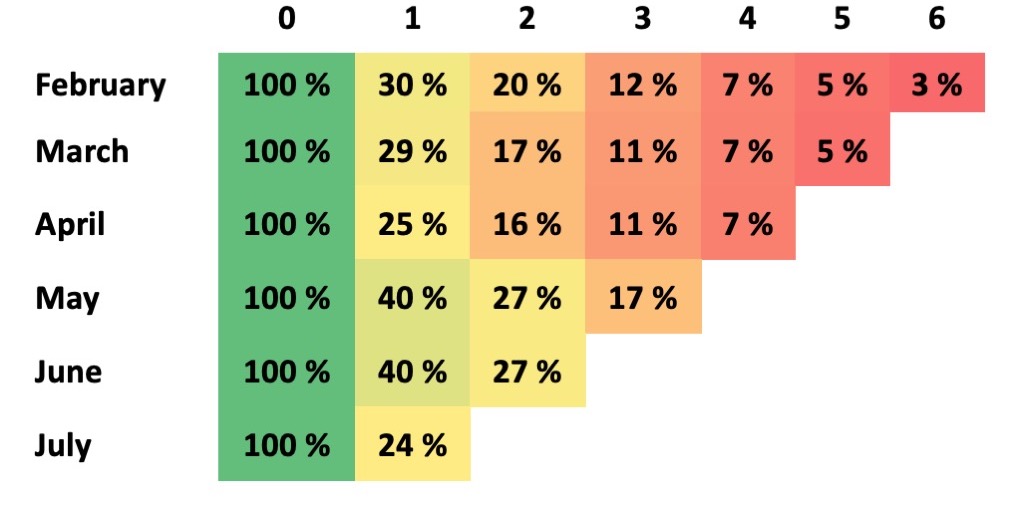
By looking at the numbers, it’s clear this example product is a leaky bucket. Most users do not stay past the first month, and only 7% remain after 4 months.
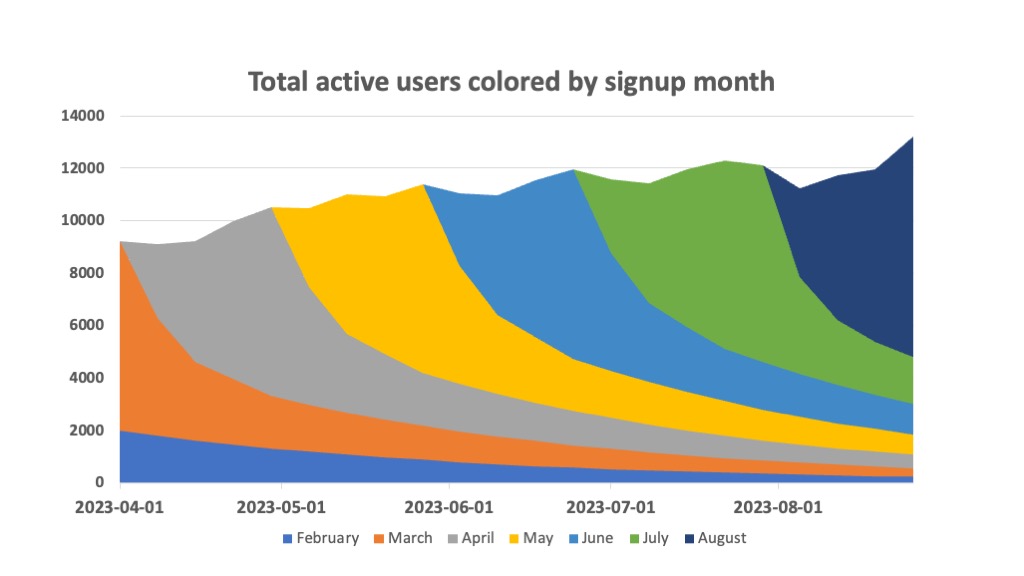
It is also possible to illustrate this in the total active users chart by coloring the users by their signup month. We end up with a stacked diagram, as shown in Figure 2, where it becomes clear that the majority of active users at any given time are primarily new users.
User retention is heavily dependent on the app category. There isn’t much optimization one can do to make dramatic improvements to what is typical for the app category, unless you completely reinvent the category. For example, dating apps will have poor retention because people find a partner and leave. In fact, the better a dating app is at matching users, the sooner they leave.
A bad product will have considerably worse retention than other similar apps in the category, indicating plenty of room for improvement. Therefore, it is crucial to measure and conduct cohort analysis correctly to understand how the product is performing, identify where the problems are, and determine how to address them.
You should look for the months or weeks where the highest drops occur. Try to understand why users leave during these times. Track their actions within your product at a more detailed level to understand what is happening. Interview some of these users to uncover the true reasons behind their actions. Data can tell you the “what,” but you often need to talk to your users to learn the “why.”
You can take cohort analysis further by studying how users from different sources behave. Sometimes the problem isn’t your product but the type of users you acquired. For example, you might have acquired a certain type of user with a misleading ad campaign, leading them to churn while your ideal users stay. To find these issues, you need to segment your users by:
- Acquisition source (which campaign, site, etc. they came from)
- Device
- Country
- Demographics
- And much more
Then study these segments individually to get a clearer picture. Do cohort analysis for each and compare.
It’s worth mentioning that cohort analysis is not limited to just user retention. You can also look at revenue, such as Monthly Revenue per User (MRPU), engagement, specific actions users take in the app, and much more.
Similarly, you can have a leaky revenue bucket even if your users are not churning. For example, users might try out some paid features initially but then decide to only use the free ones.
Now you should be equipped with the basic tools to study user retention of your product with cohort analysis and determine if your product is leaking. Hopefully, this will guide you in making the right key decisions, such as which holes should be plugged or whether you should invest heavily in new user acquisition.
I will explore more ways cohort analysis can be used to improve your product and increase revenue in future posts. Meanwhile, let me know if you need any help doing cohort analysis for your product or if you have other questions related to analytics.